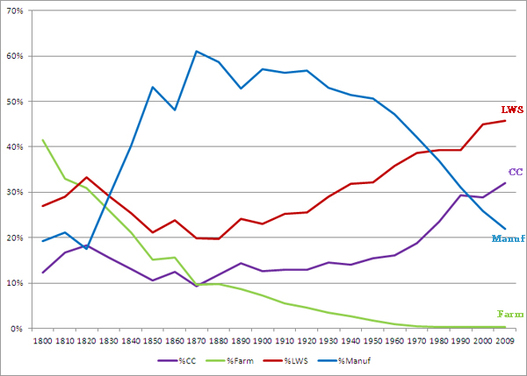
Increase in Jobs Lowering of Farms
This graph shows that the blue line is the growth of jobs during the years of the industrial revolution and the lowering of farms also during the Industrial Revolution. This shows that more and more people were leaving there farm lives and moving to the city because of more jobs.
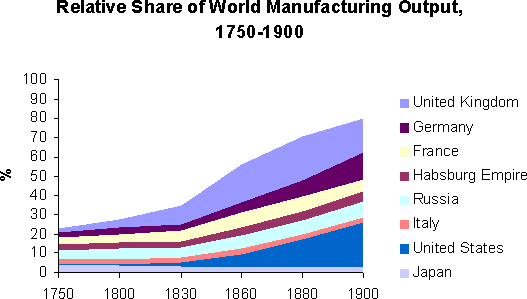
Manufacturing Output
This graph of the world Manufacturing Output during the industrial revolution shows that the United Kingdom had the most output and also shows it started outputting manufacturing to other countries during the start of the Industrial Revolution in the United Kingdom/England.
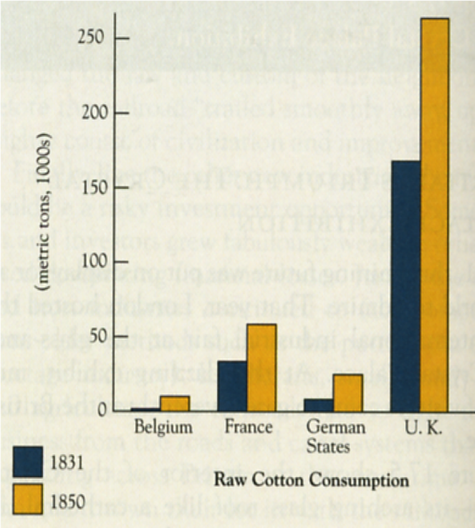
Raw Cotton Consumption
This graph especially shows the growth of the textile companies during the Industrial Revolution. This happened because of the major growth of population cotton was one of the most needed materials that people needed that moved into the city.
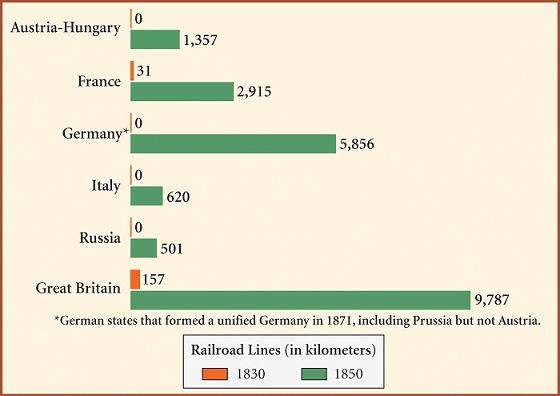
Growth in Railway Lines
When coal was first founded it was one of the first major things and is what kind of started the Industrial Revolution because after coal was found steam powered machines were invented and it grew immensely from there. The steam engine is considered to be the most important invention that was invented during the Industrial Revolution this was because transport hardly happened and if it did it was only to only somewhere close so once the steam powered train was invented people could travel to further places. So this graph shows the growth of railway lines for the steam powered trains during the 1830-1850
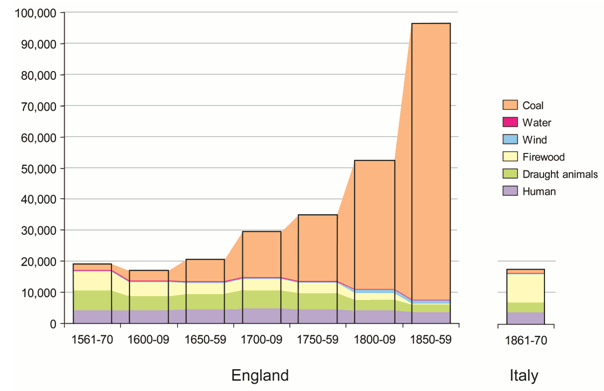
Growth of coal
This graph shows the growth of coal during the Industrial Revolution. Coal as I said before was what started the industrial revolution. So this graph shows the growth of coal how it majorly was used way more during the years between when the Industrial Revolution happened. This graph also shows the lowering use of fire wood during the Industrial Revolution which is what people used before coal was found.
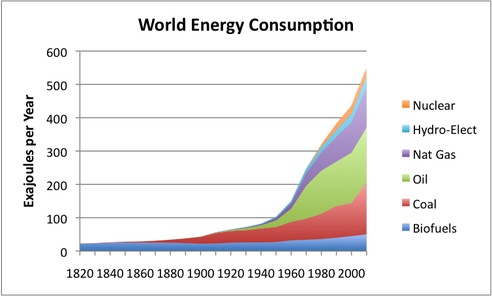
Energy Consumption
This graph shows that more energy was being used not just in England during the Industrial Revolution but also after the Industrial Revolution in England it shows that all around the world was also using more energy. They most used energy was oil, coal and nat gas.
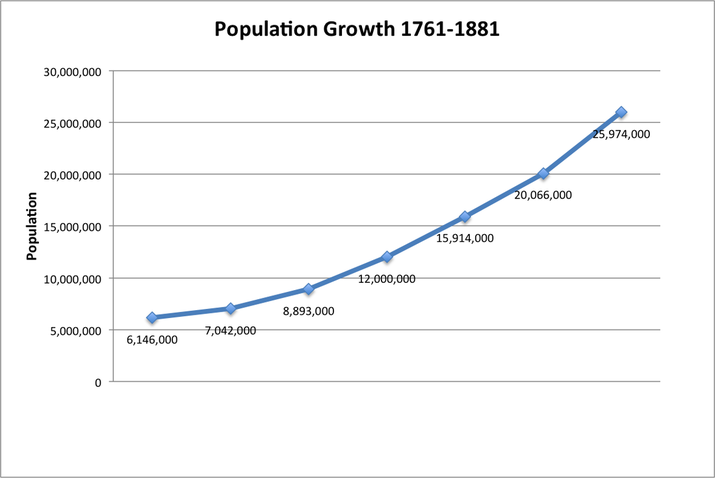
Population growth
This graph shows that the population growth became millions more during the years of the Industrial Revolution. The population grew because once factories grew and manufacturing got easier there was more food which then lead to population growth during the Industrial Revolution.
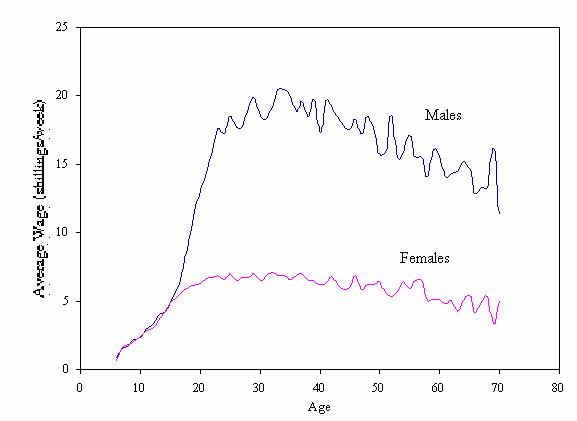
Average Wage in Industrial Revolution
This graph shows the wage of people during the Industrial Revolution. It shows that males got way more money for working then females did as they got older. This was because that male work was harder and life frightening but I don't think that was completely true. It also shows that even the young kids and young teenagers didn't get that much money even though they spent the same about of hours that the older adults did.